


Study on the structure of Sp and antibody Fab complex
123
Details
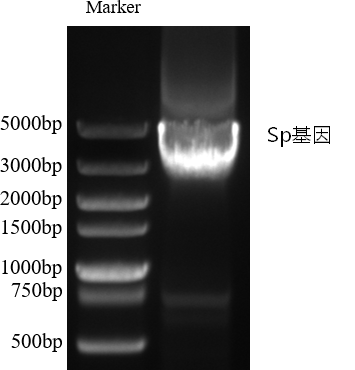
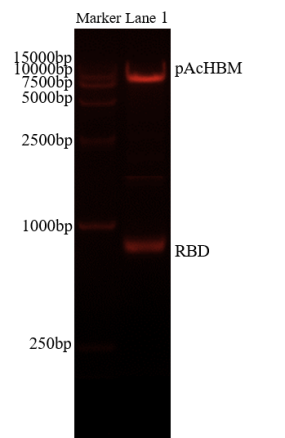
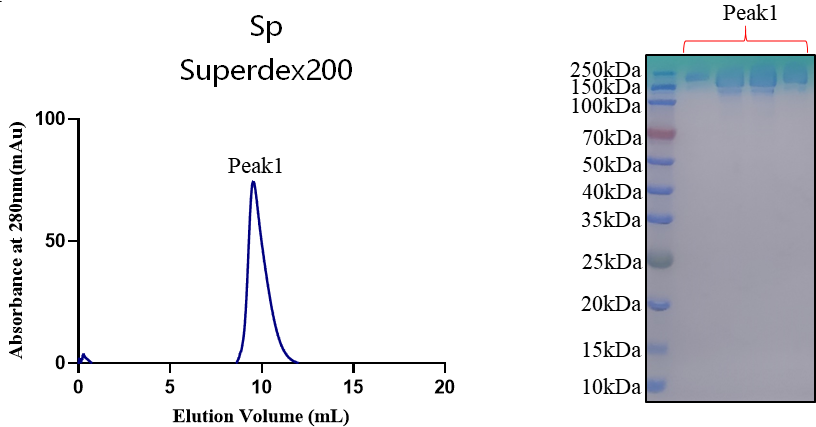
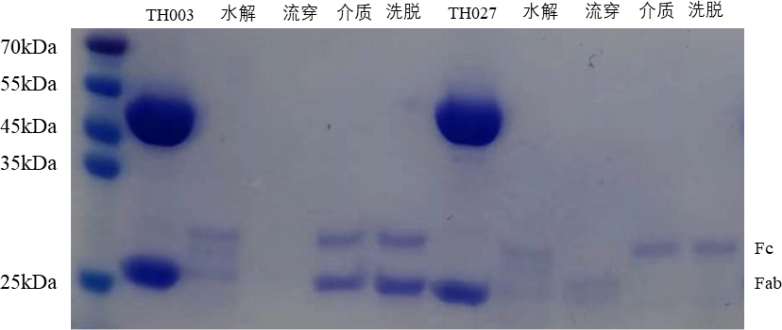
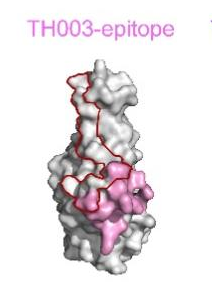
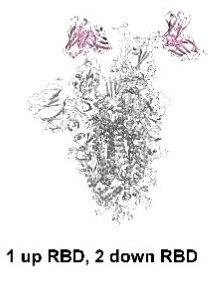
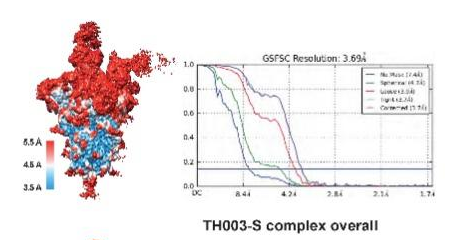
1. Vector construction 1.1 Target gene amplification and modification design: Sp gene amplification: Sequence optimization for the extracellular region of Sp, introducing a stable conformation 2P/6P mutation, a furin cleavage site GSAS mutation and a C-terminal T4 foldon trimerization domain. PCR amplification was carried out using high-fidelity DNA polymerase to obtain a target gene fragment of about 3700 bp. Antibody expression construction: Clone antibody TH heavy and light chain genes into expression vectors. 1.2 Identification and physicochemical prediction of recombinant plasmid were carried out using double restriction enzyme digestion and Sanger sequencing confirmed that the sequence was correct. Bioinformatics tools such as ExPASy ProtParam were used to predict the molecular weight, theoretical isoelectric point and extinction coefficient of the recombinant protein. Figure 1.2-1 Sp gene PCR amplification gel electrophoresis (showing ~ 3700bp target band) Figure 1.2-2 pAcHBM-RBD double enzyme digestion identification 1% agarose gel electrophoresis results 2. Expression and purification 2.1 Sp trimer expression and purification: Expression system: Use HEK293F cell expression system to carry out transfection and high-density suspension culture expression. Purification strategy: Cell supernatant is first purified by Ni-NTA affinity chromatography, and then purified by size exclusion chromatography (SEC) using a Superdex 200 10/300GL column. Purification results: The spectrum showed a single symmetrical elution peak, that is, the expressed Sp was a highly uniform and stable trimer. Figure 2.1 Elution map of Sp gel filtration chromatography (Superdex 200) and SDS-PAGE purity identification electropherogram expressed by HEK293F expression system 2.2 Preparation of antibody Fab fragment: Purified elite full-length IgG antibody was subjected to site-directed enzymatic hydrolysis using papain. Pass through a Protein A affinity chromatography column, collect the flow through fluid and specific elution components, and efficiently separate and purify the Fab fragment with high purity. Figure 2.2 SDS-PAGE identification of the Fab fragment after antibody TH was digested by Papain and purified by Protein A Figure 2.3 Binding kinetics and affinity determination: The binding affinity (KD) of the purified Fab to Sp was determined using Biacore 8K surface plasmon resonance (SPR) technology to be 2.55 nM.& nbsp;3. Complex assembly and frozen sample preparation 3.1 Sample mixing and incubation assembly: Take 3 µL of Sp protein (1.5 mg/mL) and 1 µL of a single antibody Fab fragment (1.5 mg/mL), incubate on ice for 30 minutes, so that Sp and Fab can fully bind to form a high-affinity complex. 3.2 Vitrification preparation of frozen carrier mesh: Instrument and environment: ThermoScientific Vitrobot Mark IV was used, and the chamber temperature was controlled to 8 ℃ and the relative humidity was 100%. Mesh carrying treatment: Use a 300-mesh Quantifoil Cu R0.6/1.0 copper mesh and undergo glow discharge for hydrophilization. Sampling and cryopreservation: Take 3 µL of the incubated complex suspension and add it to the copper mesh, set Blot time = 3 s, Blot force = 0, Wait time = 8 s, filter paper absorbs the excess liquid and quickly put it into liquid ethane cooled by liquid nitrogen for rapid vitrification and cryopreservation. nbsp;4. Cryo-electron microscope structure analysis 4.1 Data collection and calculation processing: Using a FEI Titan Krios 300kV microscope combined with a K3 direct electron detector, using SerialEM to automatically collect data at a magnification of 29,000× (pixel size 0.82 Å/pixel). Motion correction, CTF estimation, particle selection and extraction, and multiple rounds of 2D classification are performed in cryoSPARC. High-quality particles are screened through Ab-initio reconstruction and 3D Heterogeneous Refining for NU-refinement. Local Refinement is used to focus the bonding interface, significantly increasing the resolution of the interaction interface to 3.2 Å-3.8 Å. 4.2 Structural characteristics and main findings: The structure of the complex of antibody Fab and Sp was analyzed. Interfacial residue side chain interactions: The hydrophobic pockets, hydrogen bond networks and key salt bridges (such as D56/D58 and K444/R498) formed by the antibody and key RBD residues (such as L441, K444, L455, F456, R498, etc.) were analyzed. Figure 4.2-1 Three-dimensional freezing electron microscope density graph and overall structural model graph of antibody Fab and Sp complex 4.2-2 Gold-standard FSC resolution evaluation curve of complex and its interface

- Address:Room 202, Block B, Nanfeng Building, Nanshan Yungu Innovation Industrial Park, 4093 Liuxian Avenue
- Tel:+86 0755 86727654
- Email:marketing@longlightech.com
Technical support:Xike Network 备案编号:粤ICP备11072888号